Introduction
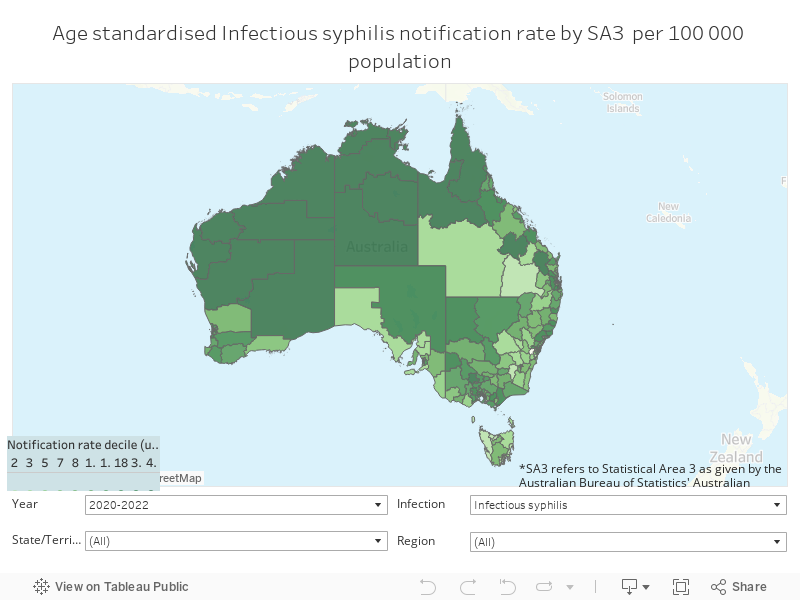
The interactive map below shows notification rates for the conditions presented in the HIV, viral hepatitis and sexually transmissible infections in Australia: Annual surveillance report.
Instructions on how to use the map are shown below.
- To select the population of interest, filter by condition, year grouping and region using the drop down menus below the map
- For a reference to the colour hue vs. the notification rate, see Colour legend to the bottom and to the left of the map.
- The age-standardised rates are presented per 100 000 population, by infection, Statistical Area 3 and three year grouping.
- To see the map in full screen select the box icon to the bottom right of the map.
Overall notification numbers as well as detailed breakdowns, analysis and interpretation are published annually in the HIV, viral hepatitis and sexually transmissible infections in Australia: Annual surveillance report.